Every API call made by an integration is automatically logged by GrowerIQ. The log viewer provides full visibility into what your integrations are doing, making it straightforward to troubleshoot issues, verify activity, and produce evidence for compliance audits.
In this article
Accessing the Log Viewer
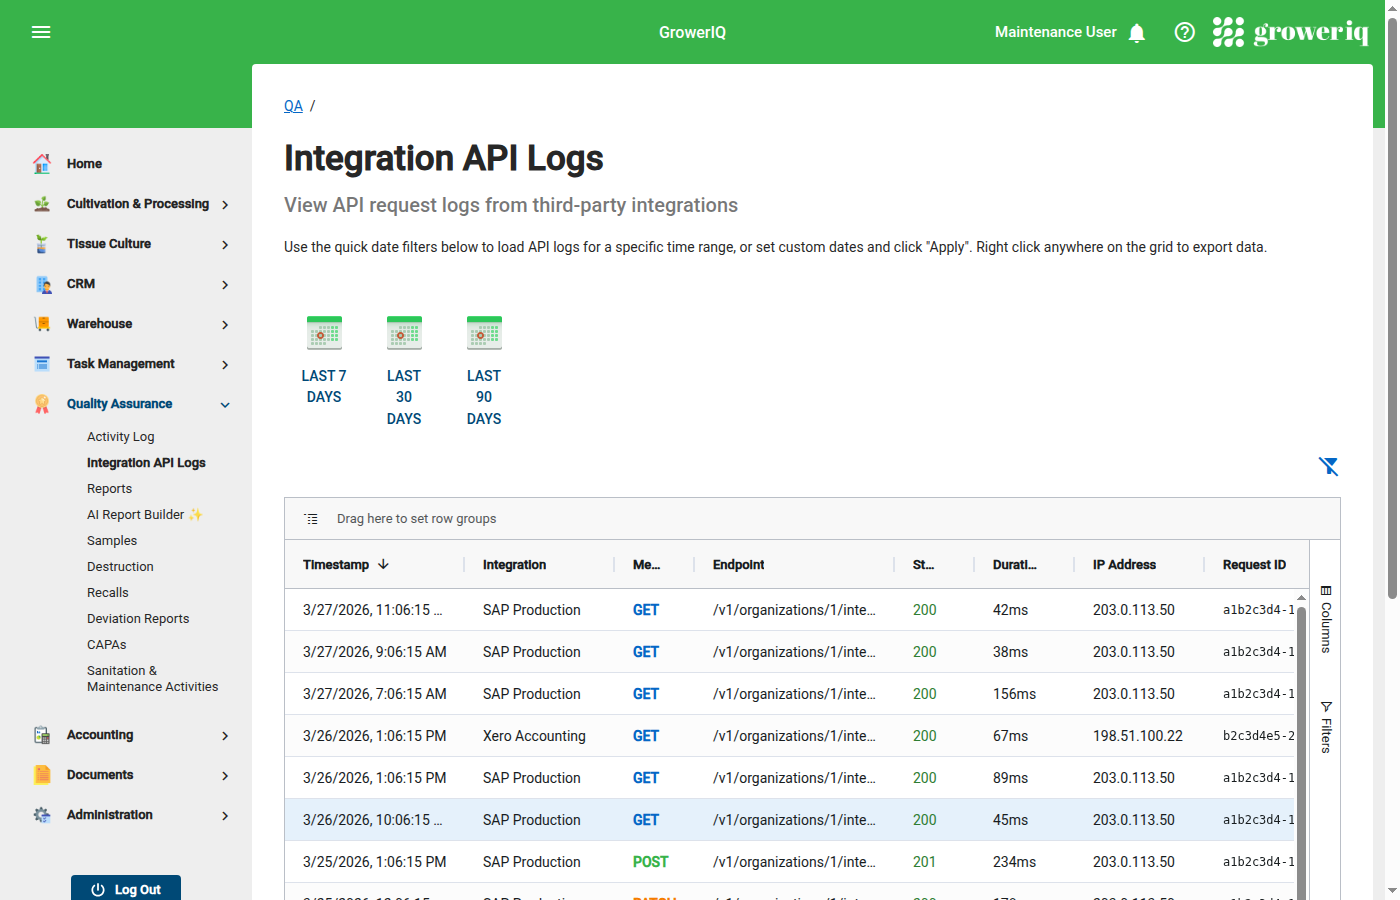
Navigate to QA > Integration API Logs to open the log viewer. The page displays a table of all API requests made by integrations, sorted by most recent first.
Permissions required
Only users with QA or Administrator roles can access the Integration API Logs page.
Understanding Log Entries
Each row in the log table represents a single API request. The following columns are displayed:
| Column | Description |
|---|---|
| Timestamp | Date and time the request was made |
| Integration | Which integration made the call |
| Method | HTTP method used (GET, POST, PATCH) |
| Endpoint | API path that was called (e.g., /lots, /orders/123) |
| Status | HTTP response code: 200 = success, 4xx = client error, 5xx = server error |
| Duration | Time to process the request, in milliseconds |
| IP Address | Origin IP address of the request |
| Request ID | Unique identifier for this specific request |
| Error | Error code if the request failed (e.g., insufficient_scope, rate_limit_exceeded) |
Filtering Logs
Use the filter controls at the top of the log viewer to narrow results:
- Integration -- select a specific integration to view only its requests.
- Date Range -- set a start and end date to view logs within a specific window.
- Status -- filter by success or error to isolate failed requests.
- Endpoint -- search for a specific API path to see all calls to that resource.
Combine multiple filters to quickly locate the entries you need. For example, filter by a specific integration and error status to see only its failed requests over the past week.
Common Use Cases
Troubleshooting with a partner
When working with an integration partner to resolve an issue, locate the failed request in the log viewer and share the Request ID. This allows both sides to reference the exact same request without ambiguity.
Finding the Request ID
The Request ID also appears in the X-Request-ID response header returned by the API. Share this value with GrowerIQ support or your integration partner for faster resolution.
Verifying integration health
Check that an integration is actively making calls and receiving successful responses. A healthy integration shows recent timestamps with predominantly 200-series status codes.
Detecting rate limit issues
Filter by Status for 429 response codes. If an integration is hitting rate limits, you will see clusters of 429 entries. Consider adjusting the integration's request frequency or contact GrowerIQ support to discuss rate limit increases.
Compliance audits
For SOC 2 and other compliance frameworks, the log viewer provides evidence of access controls in action. Export the page or take screenshots to document which integrations accessed which endpoints and when. Auditors can verify that integrations operated within their assigned scopes.
Security investigation
If an integration's credentials are suspected of being compromised, use the log viewer to review which endpoints were accessed, from which IP addresses, and at what times. This information helps assess the scope of any unauthorized access before revoking the credentials.